Reports View
TeacherKit knows that it is not only about managing your classes in an easy way, but also to bring this data out in a good visualized format to help you stay on top of your class performance.
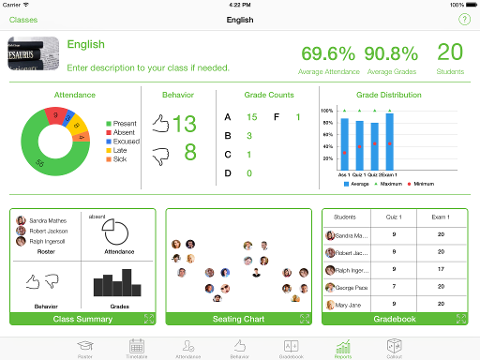
Whether you are looking for a quick summary view or detailed insights on your class performance, the all new Reports tab is a must have for you. Now you will be able to have the insights to discuss the performance of the class with your co-class teachers.
View the overall distribution of your class attendance from the attendance pie chart, or see it organized weekly (in the report).
In the behavior overall page view the number of positive and negative behavior records recorded, or also with the weekly distribution (in the report).
In Gradebook at a glance view the maximum, minimum and average class scores for each gradable item which helps you spot the variations across your students.
Spotting students at risk, or finding excelling students have never been easier. Take data driven decisions confidently.
When it comes to more details, here comes the role of “Generating Reports” feature, which helps you generate valuable data and charts for your class and students’ performance.
It will look the as it looks in your roster view when you are in the ” Seating Chart” view mode:
NOTES:
Download a sample of the report.
You can print reports from your device using airprint.
You can share the reports (in PDF format) via e-mail.
You can open the reports in another apps (i.e. iBooks).
*Generating reports is part of the premium package.